Topics on this page
Updated March 16, 2024 to reflect the addition of INP to Core Web Vitals and the official statement that Core Web Vitals is/are a ranking factor.
Once you’ve checked your core web vitals and discovered you have some fixing to do, the question becomes one of where to begin.
This page is an overview of my favorite core web vitals tools (and one I don’t recommend), all of which happen to be free (because I only pay for tools that do something I can’t do myself). This is a kind-of exhaustive list of tools, but not exhaustive about what you can do with the tools. The descriptions are highly focused on core web vitals optimization.
Throughout the page I use all kinds of acronyms and I don’t explain some technical things. I assume that if you are looking at this page you can figure out how to Google for definitions of things you don’t yet understand.
List of Core Web Vitals Tools I Use
| Tool and Links to Details | Where to Find It | What It’s Best At |
| Google CrUX Database | Website, API, and Dashboard | This is where all of your actual core web vitals data is stored and it powers other reporting tools like PageSpeed Insights. The Dashboard is great for sharing specific CWV issues with stakeholders |
| Google Search Console | Website | Showing progress in core web vitals improvements; identifying problem templates or site features that need improvement |
| Google PageSpeed Insights | Website | Competitive research because you can see the CWV info for any public URL (not just home pages) |
| Google Web.Dev | Website | Substantive learning about how to fix the things that are causing your core web vitals to fail (and other interesting things) |
| Google Lighthouse | Browser tool | A way to see how your core web vitals appear in your own browser, especially while you’re trying to fix things — I don’t recommend this tool |
| Chrome Performance Insights | Browser tool | A better-than-Lighthouse way to see which specific components are contributing to your core web vitals issues — I highly recommend this tool, especially for devs who want to find and fix problems quickly |
| WebPerf Snippets | Browser tool | A quick and easy way to identify specific issues and culprits in your core web vitals — more targeted strikes compared to Performance Insights |
| WebPageTest.org | Website | Seeing the complete waterfall for all assets loaded, downloading important data to a spreadsheet, deep dives on how preconnect and render-blocking assets are impacting your site |
| #WomenInTechSEO | Slack community | Covering far more than just Tech SEO and core web vitals, this is a supportive and informative place to learn about SEO, network, and mentor others |
| webperformance | Slack community | This is a deep-in-the-weeds community of helpful performance wonks, some of whom work for Google at Web.Dev and work on building Chrome |
| RUM Core Web Vitals Visualizer | Chrome browser extension | Great tool to quickly assess the CWV for a page without leaving the page, already includes INP |
| Core SERP Vitals | Chrome browser extension | Gives you a super-handy snapshot of your CWV competition on the SERP, but it requires a Google Cloud account and API credentials (both of which are free) |
Free Google Web-based CWV Tools
As you read this guide, you might notice that many of these tools are Google-specific. This is because the data collected to determine your core web vitals comes from users of Chromium-based browsers (Chrome and Safari, on both desktop and mobile devices). Also, as far as I am aware, core web vitals only affect your ranking on Google search results.
CrUX Database
This might seem like a strange place to start, because this is one of the least known and most technical tools on this page. I’ve started here because the CrUX database is where all of the work we do for core web vitals originates — you’ll see it in Google Search Console and PageSpeed Insights, for example.
The CrUX database houses the data for the actual experience your Chromium users have on your website (and every other website). They explain it best themselves:
The Chrome User Experience Report (also known as the Chrome UX Report, or CrUX for short) is a dataset that reflects how real-world Chrome users experience popular destinations on the web.
CrUX is the official dataset of the Web Vitals program. All user-centric Core Web Vitals metrics are represented.
CrUX data is collected from real browsers around the world, based on certain browser options which determine user eligibility. A set of dimensions and metrics are collected which allow site owners to determine how users experience their sites.
The data collected by CrUX is available publicly through a number of tools and is used by Google Search to inform the page experience ranking factor.
Not all origins or pages are represented in the dataset. There are separate eligibility criteria for origins and pages, primarily that they must be publicly discoverable and there must be a large enough number of visitors in order to create a statistically significant dataset.
Overview of CrUX at developers.google.com
In order for Google to actually show the CrUX data for a website or URL, it must have at least 1000 visits (my best guess) in a rolling 28-day period from visitors using Chromium-based browsers like Chrome or Safari. If there are fewer eligible visits, there will be data holes in the reports.
Origin vs URL Data
Another really important thing to know about CrUX data is that it is presented in two different ways depending on the tool you’re using: Origin and URL.
- Origin data refers to all pages on a website.
- URL data is specific to a single URL. As far as I can tell, there is a requirement to have at least 1000 visits to a single URL to see CrUX data for that URL.

In this example from one of my websites, which includes the core web vitals added by a browser extension I recommend later in this guide, you can see that my Best Wine Clubs page gets enough traffic to have its own URL data, but my Wine Clubs for Beginners page does not.
The CrUX Dashboard from Google
I recently discovered the CrUX Dashboard. It is a custom Looker Studio report built and maintained by Google which shows you CrUX data at glance. The dataset is updated on the second Tuesday each month.
The main page of the report shows LCP, FID, and INP data by device. As of March 16, 2024, it still includes FID, but not as a CWV. The CrUX Dashboard breaks down what percent of your URLs fall into each category of Good, Needs Improvement, or Poor for each metric.

For each metric, including the new INP core web vital, you can also see the last 10 months of data which is useful for identifying website changes which created improvements or regressions.
In addition to the true core web vitals metrics (LCP, CLS, FID, and INP), the Dashboard also includes 10-month lookbacks for TTFB (Time to First Byte) and FCP (First Contentful Paint), DOM Content Loaded (DCL), Onload (OL), a device distribution and a connection distribution (so you can better understand which types of devices and connection speeds make up the bulk of your site visitors).
This report is mostly helpful for SEOs and Devs who want to present high-level data to C-suite and other senior stakeholders, especially if you need to point to a significant change like how the work you have already done impacted users positively or negatively.
Google Search Console
As an SEO, I firmly believe the most accurate information about how a website is performing at Google comes from GSC. It’s not a complete tool, but when it comes to CWV, it’s the best place to start. Within GSC, there are two reports to pay attention to for CWV: Page Experience report and Core Web Vitals report.

The Page Experience report tells you very quickly if you need to pay attention to core web vitals in the near term. This example site definitely has some work to do if they decide it’s important to their business.

The Core Web Vitals report has URL-level detail about what’s happening on a website, including a 90-day history of the core web vitals from CrUX.
This sample report shows that all of the URLs on this website have problems for both mobile and desktop users. You can dig in to find out which URLs are causing problems.
The first part of the report, “Why URLs aren’t considered good” outlines current issues with a website.

If you were to drill down further, you would see which URL groups Google is reporting poor performance on. This information is important as it helps you assess which page templates or specific website features might need improvement.
I can’t show you a sample of this data without disclosing sensitive client information, so you’ll need to go explore your own Core Web Vitals report in Google Search Console.
PageSpeed Insights
Another free tool offered by Google to help website owners assess and fix core web vitals issues is PageSpeed Insights. This standalone website takes any URL and checks the CrUX database for information about how it is performing, and then also runs a “lab” test to get real-time information.
Let’s check the home page of ESPN — it’s a major website that has lots of good data available. The screenshots below show how the ESPN home page fails core web vitals for both mobile and desktop users.


The data in these two reports is exactly the same as the data in the GSC reports as it all comes from Google’s CrUX database.
Where the PageSpeed Insights report stands out, compared with GSC, is that it also shows you “lab” results and recommends things to fix.
These lab results are computer-operated simulations which may or may not match your real user’s experience, and therefore the lab results probably don’t match your actual CrUX data. This is a confusing point but really important to understand. Here is the lab report for ESPN’s desktop users.

And here are the things it recommends fixing.

As someone who has much experience finding and fixing core web vitals issues, I can tell you that this report is enough to get you started, but in most cases won’t really fix your failing metrics and will waste a lot of your time. This is because, as they point out in teeny tiny type, “These suggestions can help your page load faster. They don’t directly affect the Performance score.”
Why don’t they tell you what WILL actually fix your core web vitals? Because the solutions are highly variable depending on how your website is built, which third-party scripts you’re using, which design features you have enabled on your site, etc.
To find out how to fix most of your core web vitals issues, you need to spend a lot of time learning about the causes of core web vitals failures, researching solutions, and tinkering with your website until you get them right. Or you can hire an SEO professional who loves core web vitals — like me.
WebDev (Where to Learn What You Need to Know)
For many SEOs and Devs, the journey to learning about how to fix Core Web Vitals involves a lot of reading at Web.Dev. In Lighthouse-based lab reports many of the recommendations for how to fix things are detailed at Web.Dev.
What is Web.Dev? It’s kind of a weird URL, but it’s an incredibly helpful website created by the Chrome Developer Relations team at Google. Who better to tell you how the Chromium browsers work than the teams that build them?
They have an incredible knack for both writing their own content and sourcing/referencing other people’s content that correctly explains how to solve problems.
They have a whole section on Core Web Vitals and there is so much to learn. Whether you’re looking at articles for in-depth reasoning behind issues and solutions or you want to take a free course to deepen your knowledge about a subject area, they are chock full of great information.
There are also code patterns to help you get started. Here is one I recommend to clients all of the time regarding how to make Google fonts faster.
Free Google Chrome CWV Tools
Performing exploratory missions and some testing in websites with real Google data is a useful part of the core web vitals optimization process, but it’s far more illuminating to get into the details of how your website loads specific assets and how those assets are impacting your specific metrics.
Lighthouse
Note: I’m not going to include more screenshots here because you’ve already seen Lighthouse data in the PageSpeed Insights section of this guide.
Lighthouse is the first performance tool most Devs and SEOs encounter. For some, it’s where the journey stops, which is really too bad, because it’s not a great tool. You can spend a lot of time spinning your wheels trying to make it happy, only to see no improvement in your actual core web vitals.
Why is this the case? Well there are two main reasons…
First, Lighthouse provides you with Lab data. Lab data and real-world data are not the same, but your actual core web vitals metrics are real-world data. It doesn’t really matter what’s happening in your browser on your computer today (the Lab data), it matters what is happening with 75% of your users in Chromium-based browsers in the last 28 days.
Side note: some people call the “real world data” RUM (Real User Monitoring) and it is its own discipline within core web vitals, most often applied for JavaScript-rich websites, applications, and video-heavy websites.
Second, Lighthouse recommendations are… sort of disconnected from the root causes of core web vitals issues. It recommends things like:
- Reduce initial server response time: this correlates to TTFB, which is critical to all core web vitals metrics, but is really difficult to reduce. This is not the best place to spend Dev time unless it’s over 1 sec.
- Avoid an excessive DOM size: this correlates to… I don’t even know, maybe CLS? Regardless, reducing the number of DOM elements on the page (every single wrapper, container, div, p, span, etc.) could help, but again, not where I’d start. This is good to focus on in a redesign.
- Reduce unused CSS: theoretically this could help with CLS, but it’s really hard to do it on an existing website, whereas concatenating, compressing, and caching your CSS is much easier.
To access Lighthouse data in your browser, you can open the Chrome DevTools and navigate to the Lighthouse application (which might be hidden behind a double-carat symbol).
I don’t like Lighthouse (I’ve made that clear, right?) and part of the reason is because I think it sends well-meaning and busy developers looking in the wrong direction. Instead, I strongly recommend adding the Performance Insights tool to your Chrome browser.
Performance Insights Panel
This tool radically changed my understanding of core web vitals, improved my efficiency in diagnosing and fixing problems, and helped me communicate issues to clients and their web teams more effectively. I highly recommend using it to do the same for your website. Here’s a quick tour of my favorite bits.
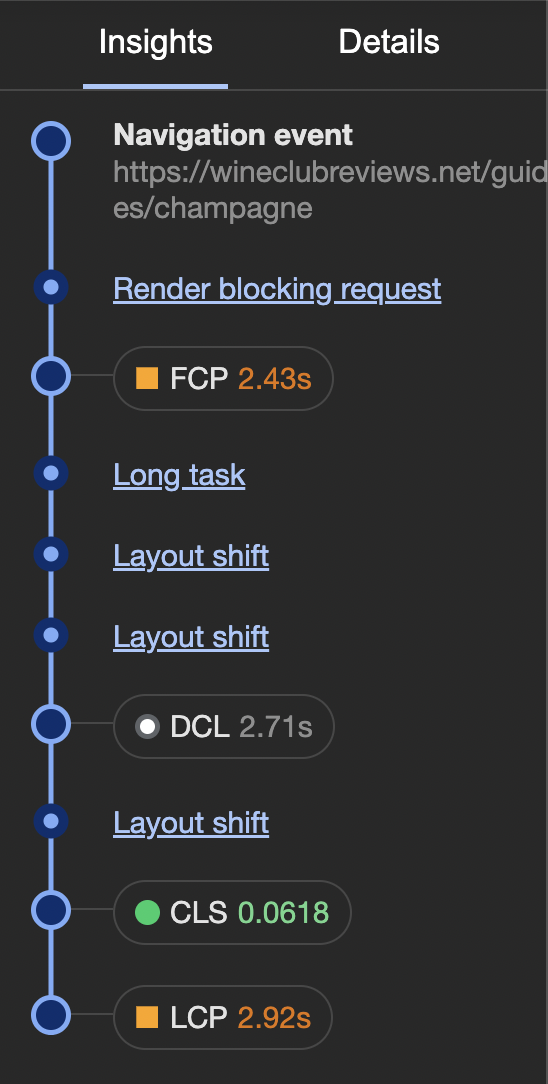
After running a test on my browser, here is what the Insights panel turned up for one of my websites:
- There is a render blocking request
- My FCP is 2.43s
- After which some “Long task” occurs
- Then there are two Layout shifts (those contribute to CLS)
- After the DOM Content Loaded at 2.71s, there was another CLS-contributing layout shift.
- Lastly, the LCP dragged across the finish line at 2.92s
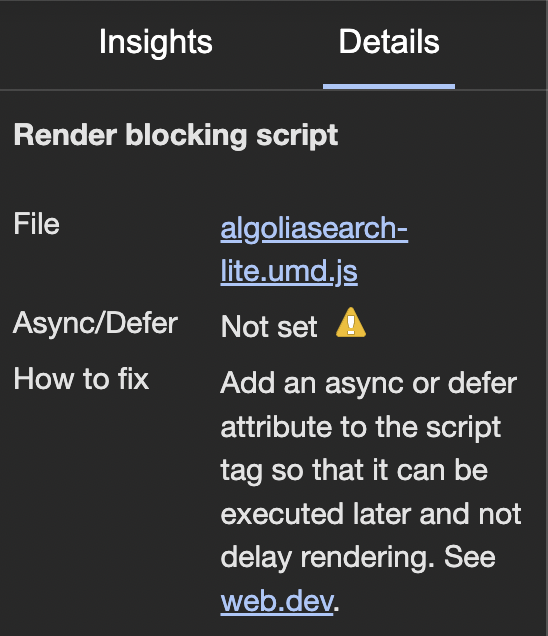
Focusing on that render-blocking request…
I clicked the linked text “Render blocking request” and it opens the Details panel. I see that the culprit is part of my Algolia installation.
Or the causes of CLS…
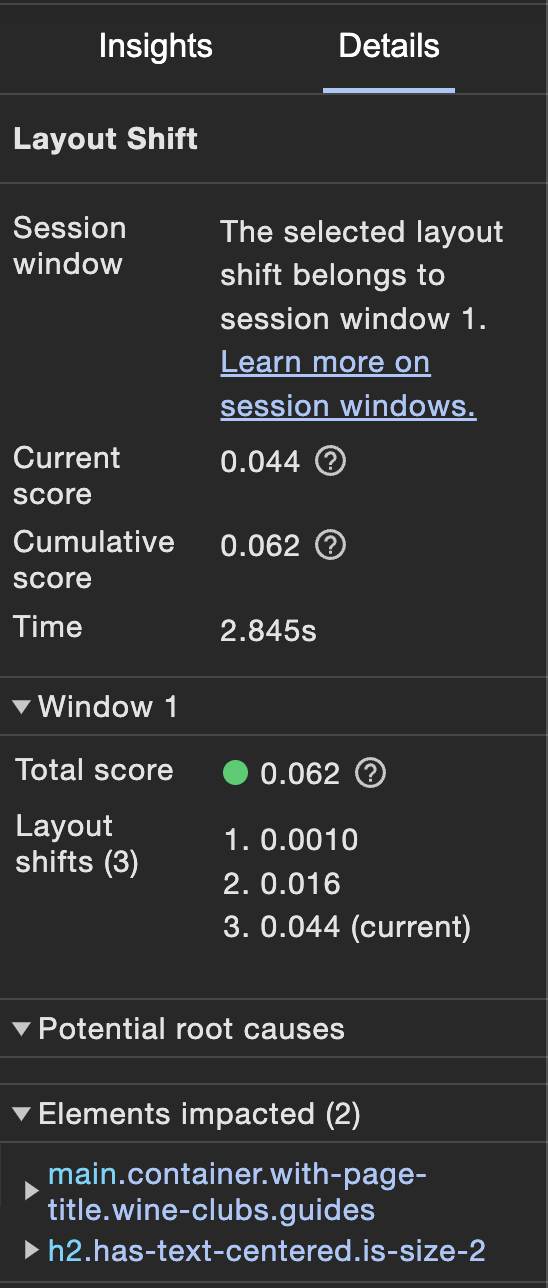 Clicking the “CLS” marker on the timeline opens this Details panel with lots of helpful information. | 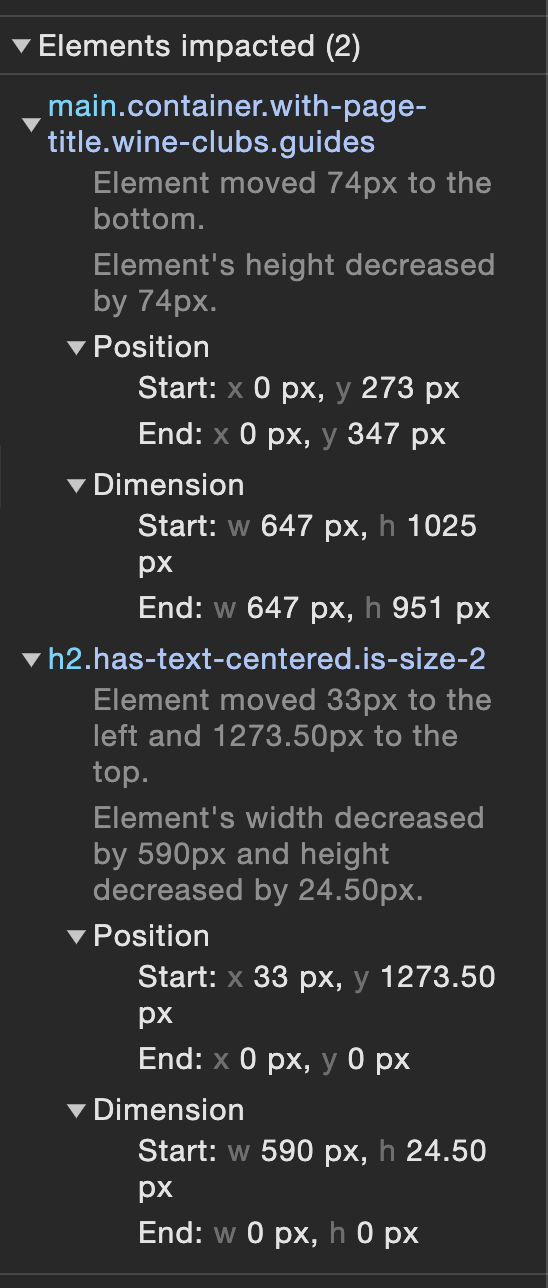 It shows you which elements are shifting, how much they’re shifting and where to/from they’re shifting. Something truly actionable! |  And it even takes a picture of the elements that move around. There is also a little video recorded which you can slow down to a speed of 10% to really see how things are moving around the page. |
I also love the throttling options. When I want to pressure-test a website or find the causes of suboptimal CrUX data, I throttle my tests to simulate a Fast 3G network. Slowing down the ability to load content really highlights where breakdowns in asset loading and rendering occur.
This page tells you how to find the tool and will get you started with usage.
Free Third-party CWV Tools
Not everything Google measures and reports on is unique to Google browsers, so third-party tools can be just as good for certain tasks. And there are a lot of really clever web developers out there figuring out how to make websites faster, so there are some really cool tools to play with.
WebPerf Snippets
I have come to rely on these amazing code snippets even more than Performance Insights. My workflow might start with Performance Insights to get a clear idea of what a page’s issues are, but as I work through documentation and fixes, I rely on WebPerf snippets because they’re faster.
You may not be aware (I wasn’t until I read about these tools) that you can add custom Javascript to your DevTools (under Sources) that you save and reuse. The WebPerf snippets output browser data to your Console. It feels fussy at first, but it’s really simple to implement them, and the creators provide excellent instructions.
Here are some examples of the WebPerf snippets for core web vitals in action.


WebPageTest.org by Catchpoint
This is a BIG multi-purpose performance measurement tool that does A LOT of things. I think their free services are their best ones (I’ve been a paid subscriber and didn’t get the benefit of it I hoped for out of the Experiments feature). In particular I love their waterfall tools for understanding complex asset loading.
If you sign up for an account, you’ll get 300 “runs” per month. Each URL test is 3 runs, so that’s more like 100. This should be enough as you should only be testing over here when you’re pretty sure you’ve resolved most of your issues or you’re just getting started with diagnostics.
I prefer WebPageTest to GTMetrix (I didn’t used to), but there are three key reasons:
- GTMetrix doesn’t let you test enough devices/browsers/locations without a paid account
- WebPageTest lets you download asset reports in multiple formats (JSON, CSV, and HAR)
- WebPageTest’s waterfall reports are more comprehensive (they call-out render-blocking assets, highlight hint usage, and break down the different parts of the connection (useful if you’re diagnosing TTFB issues)
Going back to my favorite site to use as an example (make an example of), these samples are from ESPN’s home page.
You get your standard Core Web Vitals data (from CrUX)

But you also get a full timeline. I’ve clipped it here because there are 252 separate assets loaded!

And a look at the connection waterfall, too.

But the Request Details table (the exportable data) is where this product really shines because it teaches you things as you use it (assuming you ask questions). For example, how many SEOs and Devs know about fetch priority?

Chrome Browser Extensions
It took me a long time to warm up to browser extensions. I mostly just used them to track redirects until I dug deep into core web vitals. I have two that I currently like.
RUM Core Web Vitals Visualizer
This extension, provided for free by Arjen Karel, lets you quickly see the core web vitals of any page you’re looking at right in the browser. You can also dig in a little deeper. This is a much faster way to get this data than via PageSpeed Insights, but keep in mind, this is Lab data, not CrUX data.


Core SERP Vitals
Core SERP Vitals is one of many SEO browser extensions which activate on Google SERPs. This isn’t a testing tool, it is a speedy recon tool designed to help you assess whether or not core web vitals is a factor in your rankings for keywords and pages you care about.
Here is an example of it in use

It has some technical requirements and is a little finicky to get it going, but once you have it installed, it’s awesome. You can choose whether to display Origin data or URL data, which is a helpful backdoor gauge to see how much traffic a competitor page might be getting.
To use this extension you must have a Google Cloud account (free), you must enable the CrUX API data service (free), and then you must generate an API credential to use (also free). There are instructions out there on how to do this, so just be patient.
Slack Communities
Speaking of teaching you things, one of the best places to learn about website performance and core web vitals is in Slack communities where knowledgeable people answer your questions.
Unlike Reddit where most “gurus” are anonymous and can say anything without repercussions, Slack communities are not anonymous so people behave nicely (usually).
I have two web performance communities on Slack that I spend a decent amount of time in.
The first is #WomenInTechSEO, which covers all aspects of SEO, not just Tech SEO. The community code of conduct is clear — at all times people are to be kind, helpful, respectful, and to foster a safe and judgment-free community. There is a tremendous amount of mentoring and knowledge-sharing happening in this community. SEOs from around the world are welcome (and well-represented), and some of SEO’s most famous women are participants including Lily Ray and Aleyda Solis.
The second is webperformance. I learn so much in here — some of the most visible web performance professionals on the web hang out here and are active participants in really deep discussions about performance metrics and where they’re heading. I regularly get to chat with Barry Pollard of Web.Dev and enjoy musings from Erwin Hofman, Joshua Clare-Flagg, Paul Irish, Joan León, and more.
Parting Thoughts
After a great deal of learning about web page performance over several years, I believe the best way to learn is to start with a proper diagnostic tool (like Chrome Performance Insights) on your own website. For each problem you encounter, go research the causes and see how they apply to your website.
Also, here’s a free piece of advice worth $1000s… Don’t start with Lighthouse recommendations, start with the order in which the assets on a website are loaded and learn how to properly use preconnect, preload, fetchpriority, async, and defer. This will get you most of the way there for any CWV problems.
I’m still learning everyday, thanks to these tools and especially those Slack communities. Get out there and start testing!